Effort Pace Paradox
When you are "fast" in every segment but "slow" overall

A runner showed an interesting activity screenshot from Coros. When you look at Effort Pace (EP) of every 5K segment, all numbers are <8min. However, the EP of entire activity (18.4K + 1649m ascent) is 9min.
This is confusing. Normally, one would think: If you do faster in every segment, you shall overall do faster for entire course.
The first possibiity that comes to my mind, assuming the watch and software are correct, is Simpson's paradox. At a nutshell, it is a type of paradox that statistic values demonstrate different behaviour between per-group calculation and overall calculation.
Common examples are like:
- Two new medicines are fundamentally non-effective in treating a disease. However, the mixture of both medicines are effective statistically.
- A change of taxation policy results in every group paying higher percentage of tax, but overall paying lower percentage of tax.
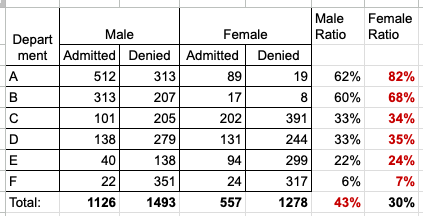
- In a school admission record, you find female enrolment rate is higher for every deparment, but the university overall has higher enrolment rate for male applicants.
The last example is illustrated in the following table:
When you inspect those paradoxes closely, there are two common traits:
- The prior distribution is drastically different. In the Berkeley example, you can see that two departments have significantly more male applicants than female applicants. Those deparments, though having higher female enrolment rate, do contribute to more male enrolments, thus resulting in university wise lower female enrolment rate.
- The statistic value usually involves division, e.g. calculation of rate/ percentage/ ratio. The sum of division of numerator over denominator, could be very different from the division of sum of numerator over sum of denominator.
In our Effort Pace paradox, we look for above two traits.
The official document of Effort Pace does not give much detail related to the implementation, but overall tells the idea:
Effort Pace is a measurement of how much power out of maximum power one exerts along a certain slope.
From the official example, we can also infer that: when the absolute speed is fixed, lower Effort Pace is better because they mean you are "more efficient" over this slope.
Slope: vertical / horizontal distance.
Notice the division in the definition of slope. Depending on how you aggregate the data, the average slope could be very different. Following is one illustrative example:

All three color elevation profile gives the same cumulative distance and cumulative ascent. However, the implication on running performance is drastically different.
The green one is highly likely the situation of the runner record. When you look at the course segment by segment, there are sharp up/ down hills and flats. When you look at overall statistics, the slope looks moderate.
Think of following artificial data:
- Seg 1: 5K, 1000m ascent, 20% slope
- Seg 2: 5K, 0m ascent, 0% slope
Overall: 10K, 1000m, 10% slope.
Put this in the context of our aforementioned runner, that means:
- The runner has higher EP on 20% and 0% slope, but lower EP on 10% slope.
- However, the runner is consistent in one activity. That means, the relative performance is caused by historical reference points.
- In other words, the runner looks to be more struggling compared to historical points measured over 20% and 0% slope; the runner looks more relaxed compared to historical points measured over 10% slope.
- The EP model thinks the runner is more close to maximum when running at 20% and 0% slope, compared to when running at 10% slope.
- It is likely that the watch uses heart rate to measure relative effort.
- To sum it up, the runner very likely had more intense (in terms of heart rate) sharp climb and flat sessions than it should be. The runner very likely had many low intensity moderate climb sessions, where the runner could increase the power exertion.