Lookup Elevation From DTM File

The GPX file is downloaded from the official website: http://www.hk100-ultra.com/hk100.html ( direct link). The GPX file is said to be prepared by Coros.
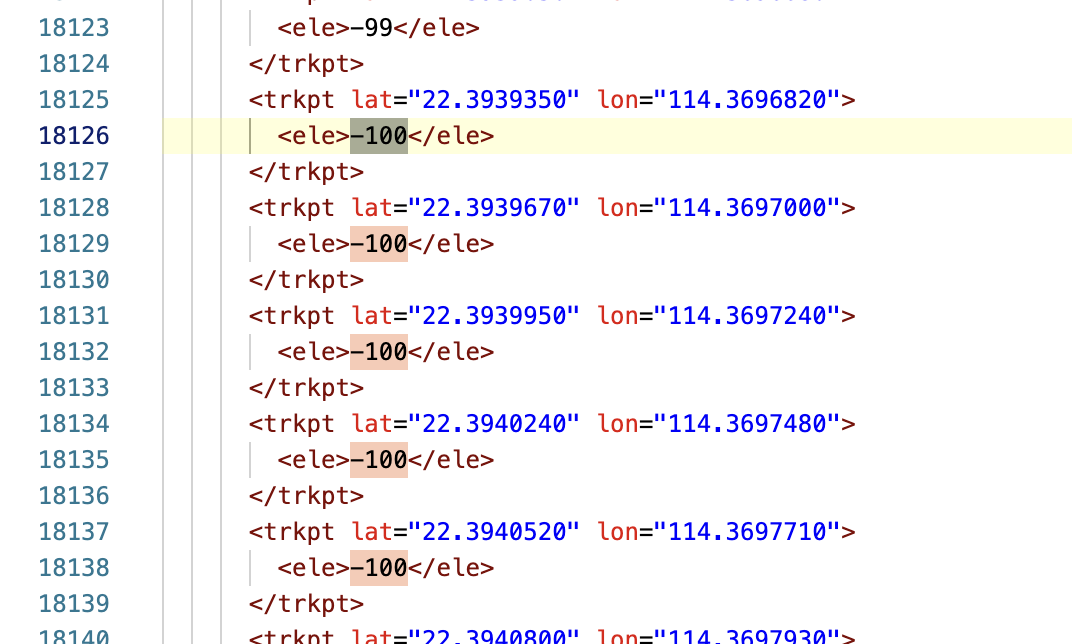
One glitch we find in the file is that there are many points recorded with negative elevation, as deep as -100m, which does not make any sense.
The course stats derived from the original file is as below:
| Key | Value |
| max_elevation | 859 |
| min_elevation | -102 |
This is also far from our understanding of Tai Mo Shan's elevation.
We can tell from the elvation profile that the relative elevation gain between points seems to be alright but the graph is shifted down somehow.
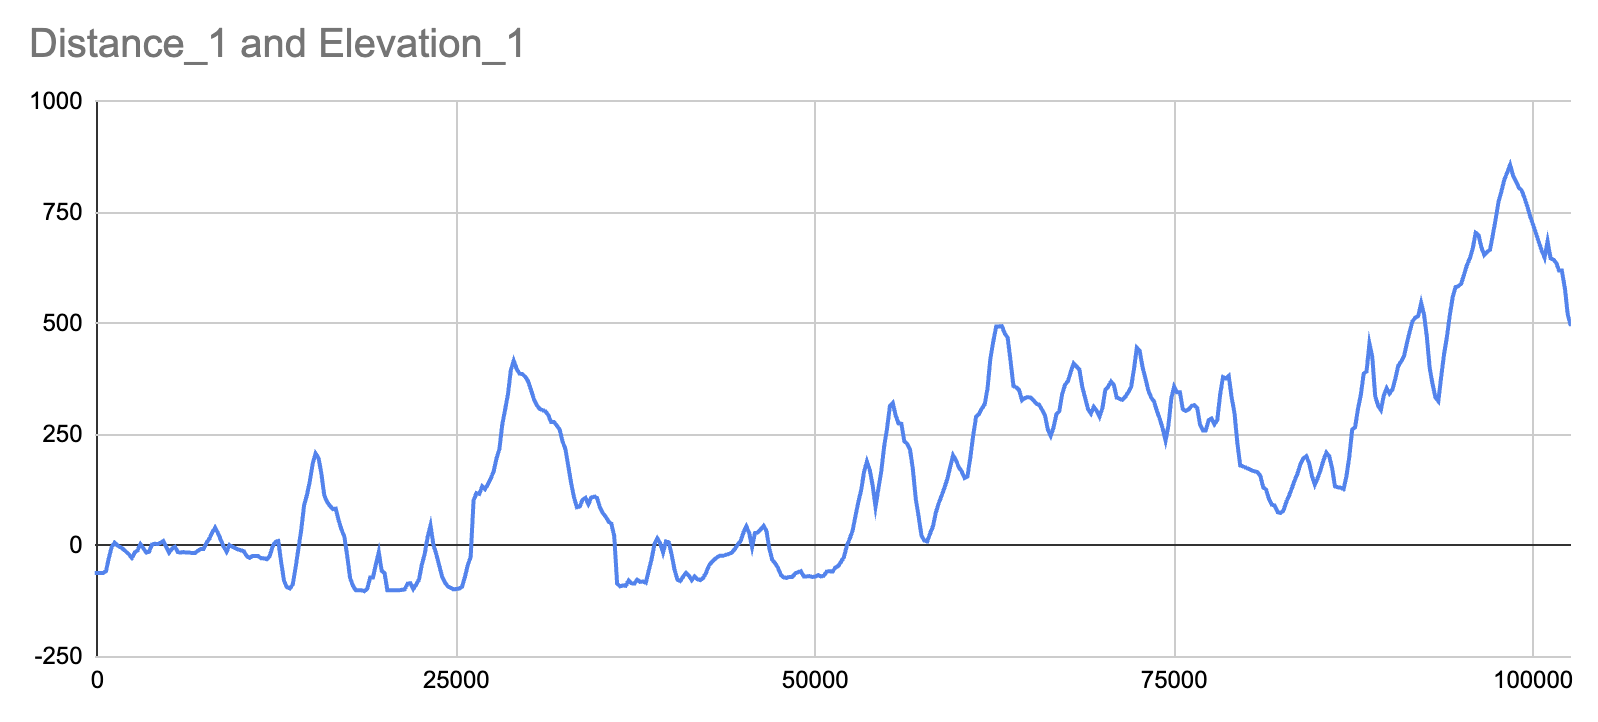
There could be multiple reasons to cause this issue, e.g. the air pressure / weather may affect elevation measurement. However, since the weather is dynamic, the tracked GPX points always have certain error and the degree of distortion varies across the day.
We use the Hong Kong government's DTM data file to fix the issue.
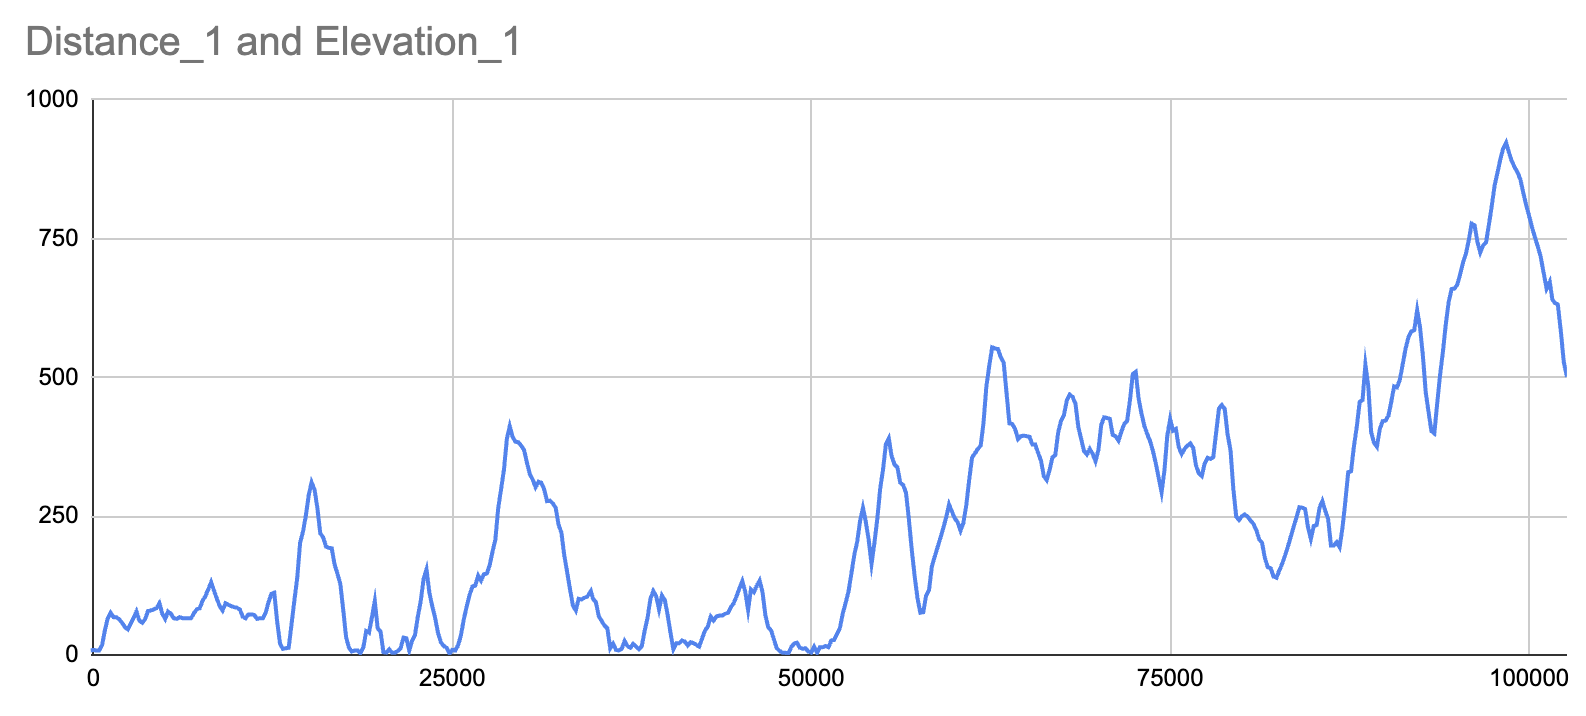
The new stats derived from our fixed GPX is as below.
| Key | Value |
| total_descent | 4897 |
| max_elevation | 928 |
Now the elevation profile also reads all above sea level.
DTM
DTM referes to "Digital Terrain Model". We use the DTM file from HK gov at 5m resolution.
Source: https://data.gov.hk/en-data/dataset/hk-landsd-openmap-5m-grid-dtm
From the official introduction:
The DTM is a digital terrain model of the Hong Kong Special Administrative Region. It shows the topography of terrain (including non-ground information such as elevated roads and bridges) in 5-metre raster grid with an accuracy of ±5m. If land area is covered by vegetation, the terrain will be depicted by the height of vegetation.
The downloaded data file is a large plain text file Whole_HK_DTM_5m.asc of about 300MB. The file is in Esri Grid format: https://en.wikipedia.org/wiki/Esri_grid .
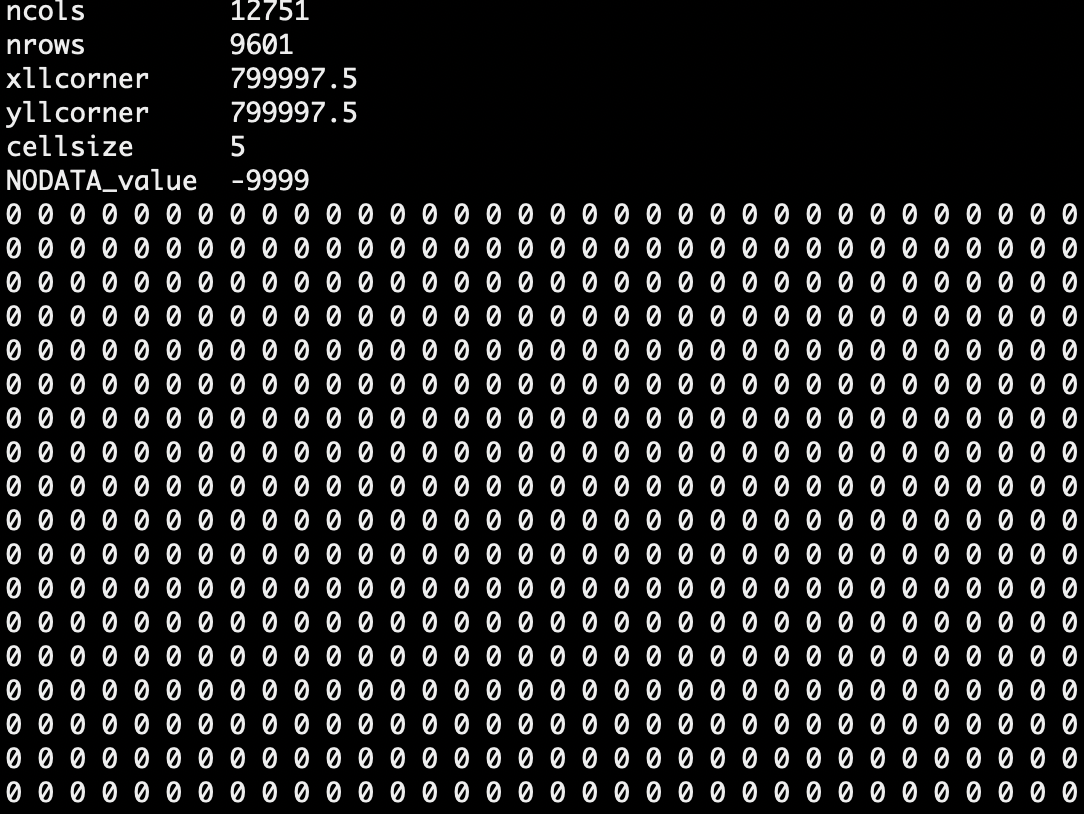
We first check the meta data:
ncols         12751
nrows         9601
xllcorner     799997.5
yllcorner     799997.5
cellsize      5
NODATA_value  -9999
The HK gov's DTM is divided into 12751 x 9601 cells, each representing a 5m x 5m block of land.
Next issue is to interpret (xllcorner, yllcorner), which is not in common longitude and latitude format. Instead those points are projected using HK1980 grid system ( EPSG:2326 ), which give better resolution and smaller distortion in the HK's context. We can convert to the well know GPS coordinates in following way:
from pyproj import Transformer
transformer = Transformer.from_crs("EPSG:2326", "EPSG:4326")

transformer.transform(799997.5, 799997.5)
(22.137987658783747, 113.82528821542601)

transformer.transform(799997.5 + 5 * 9601, 799997.5 + 5 * 12751)
(22.57165581093181, 114.44412031825885)
The mapping can also be reversed, i.e. lookup HK1980 grid from GPS coordinates. We can further locate the row number and column number, given the GPS coordinates, with a simple linear projection to find out the cell in the DTM matrix.
Following is a quick glimpse of the DTM file (upper left corner). The texts below the meta data are just a giant matrix whose cells are elevation data.
Once the above building block is ready, our fix to the HK100 course GPX is straightfoward: loop over all the trkpt elements in the file; lookup real elevation from DTM.
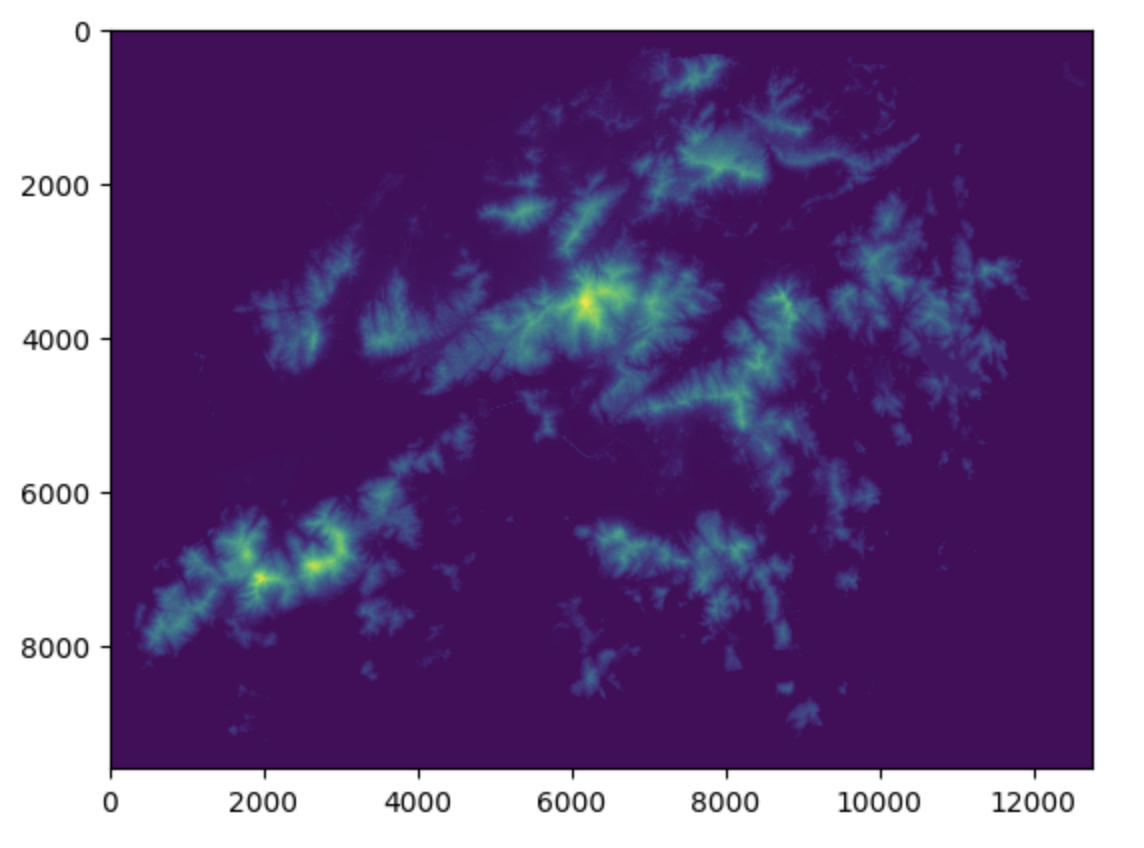
Visualize the DTM file
Here is a quick visualization of the enture DTM.
dtm_file = 'Whole_HK_DTM_5m.asc'
fh = open(dtm_file)
# Analyze meta data
meta = {}
for i in range(6):
  k, v = fh.readline().split()
  meta[k] = v
ncols = int(meta['ncols'])
nrows = int(meta['nrows'])
# Read data matrix
data = []
for i in range(nrows):
  row = fh.readline().split()
  data.append([int(e) for e in row])
fh.close()

# Generate bit map
from PIL import Image, ImageDraw
import numpy as np
bm = np.array(data)
# Normalize the [0, 1) as RGB matrix
nbm = (bm - bm.min())/ (bm.max() - bm.min())

# Show image
from matplotlib import pyplot as plt
plt.imshow(nbm, interpolation='nearest')
plt.show()
Here's the image and we can see the silhouette of Hong Kong.