Progress bar in Jupyter with tqdm
best practices and tips

tqdm is a drop-in solution to turn any iterable to a progress bar. It is useful when working on large datasets / simulations that require massive iterations, and most iterations are of similar computational size.
Tips
Here are the tips for application in Jupyter notebook environment.
T1: from tqdm.notebook import tqdm -- import the notebook version so that an image progress bar is displayed, which is nicer than the default text progress bar displayed by tqdm.tqdm.
T2: Set minimum refresh parameters, or you will likely get "IOPub data rate exceeded" error in Jupyter notebook. mininterval to limit minimum time and miniters to limit minimum iterations. Following is one example:
pbar = tqdm(range(N), mininterval=1.0, miniters=10**4)
T3: Use pbar.set_description(message, refresh=False) to place more information to the reader (yourself). Note that refresh=False is critical to instruct the progress bar not to refresh, until the set mininterval and miniters are met.
Following is a playground:
from tqdm.notebook import tqdm

N = 10**5
pbar = tqdm(range(N), mininterval=1.0, miniters=10**4)
for i in pbar:
    pbar.set_description("Total: %s" % (i), refresh=False)
    # do something here
Application
The default message of tqdm outputs the rate in form of (number of iteration per second), and also the elapsed time/ predicted remaining time. One can use set_description() to make the output more informative.
In my example, I have 20M articles to process. There are some duplicate articles. Storing the U RLs all in memory is costly, think of 20 bytes per URL, and assume 2.5x storage overhead of set() structure, the final number is 20 * 10**6 * 20 * 2.5 = 1GB. Using a Bloom-Filter can reduce the memory foot print to about 50MB (storing 30M elements with 0.1% error rate).
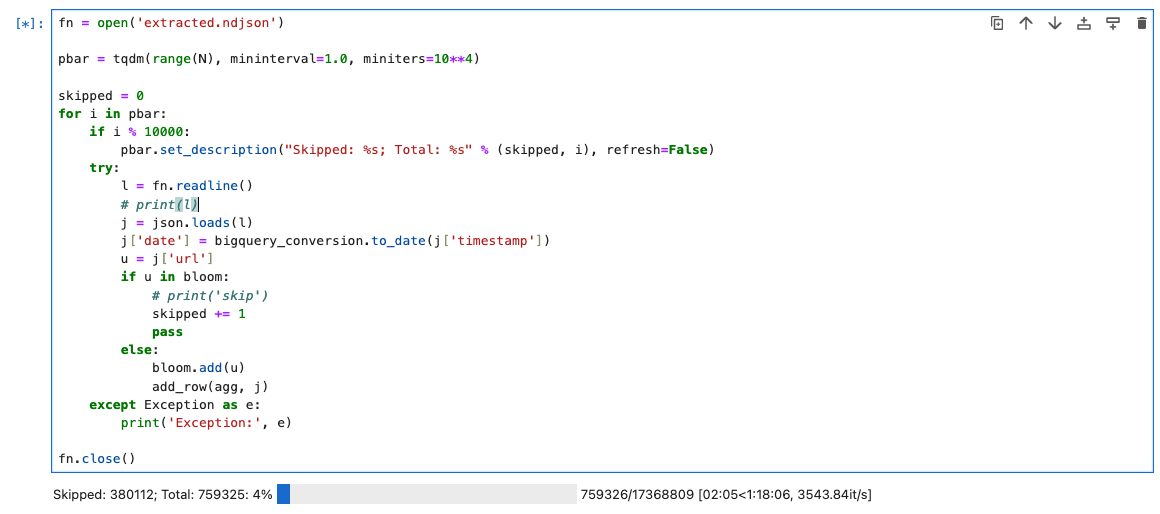
I want to display the number of skipped URLs by BF. Following the snippet of the working core.
fn = open('extracted.ndjson')

pbar = tqdm(range(N), mininterval=1.0, miniters=10**4)

skipped = 0
for i in pbar:
    if i % 10000:
        pbar.set_description("Skipped: %s; Total: %s" % (skipped, i), refresh=False)
    try:
        l = fn.readline()
        j = json.loads(l)
        j['date'] = bigquery_conversion.to_date(j['timestamp'])
        u = j['url']
        if u in bloom:
            skipped += 1
            pass
        else:
            bloom.add(u)
            add_row(agg, j)
    except Exception as e:
        print('Exception:', e)

fn.close()
See it in action like below screenshot:

Now we have a nice and tidy progress bar, with augmented status information.
Description
Here are some ideas of useful elements in description:
- Meta data like model name and attributes to help reader quickly comprehend what is being processed.
- Error count. It is best practice to wrap the core logics into a
tryclause so the whole process is not impacted by corner cases. However, we need to observe error rate to decide if something is really corner case, or systematic error. - Operating metrics. One example is the
skippedin above example.