Running Envelope
Scattered plot of endurance sport activities and the pareto efficiency boundary

Running Envelope
The running envelope is formed by combining a scatter plot with the Peter Riegel formula as an upper bound. With the running envelope, we can track the average speed that athletes can actually achieve under different (equivalent) distance conditions, thereby formulating more reasonable race plans. Compared to predictions based solely on VO2max, the running envelope provides more dimensions. By reading the running envelope, we can identify: stretch goals, realistic goals, and conservative goals.
Each point on the running envelope chart represents a workout. The horizontal axis represents the equivalent distance, and the vertical axis represents the equivalent average speed. When calculating speed, we use elapsed time rather than removing rest time from the workout time. This chart can compactly present our current workout experience.
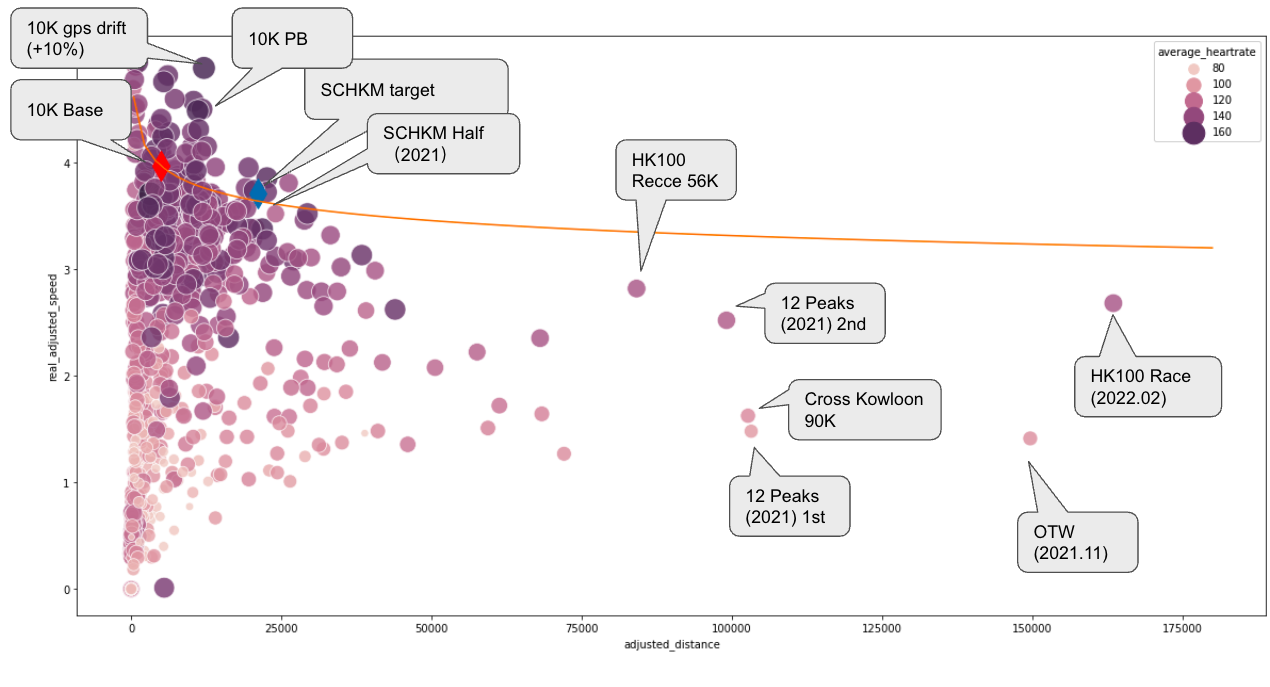
Example of a running envelope Chart (2022)
Generally speaking, runners aim to go farther or faster. Therefore, points closer to the upper right corner belong to efficient points (Pareto efficient). Connecting these points that are faster and farther forms a boundary, the Pareto boundary. Several decades ago, Peter Riegel found an empirical formula to describe this boundary. So, we can use the same method to predict longer distances (e.g., 100K) based on shorter distance runs (e.g., 50K).
Example
Let's analyze the goal for the Standard Chartered Marathon.
Here are the parameters supported by the tool. Some default values have already been filled in on the actual webpage.
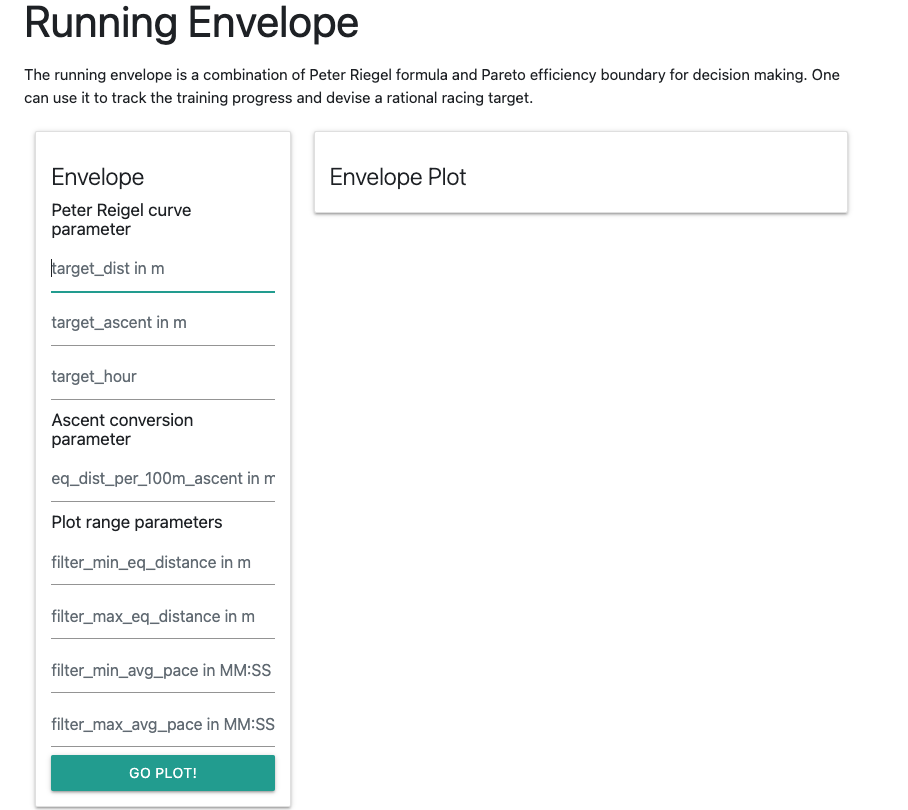
Blank parameter page
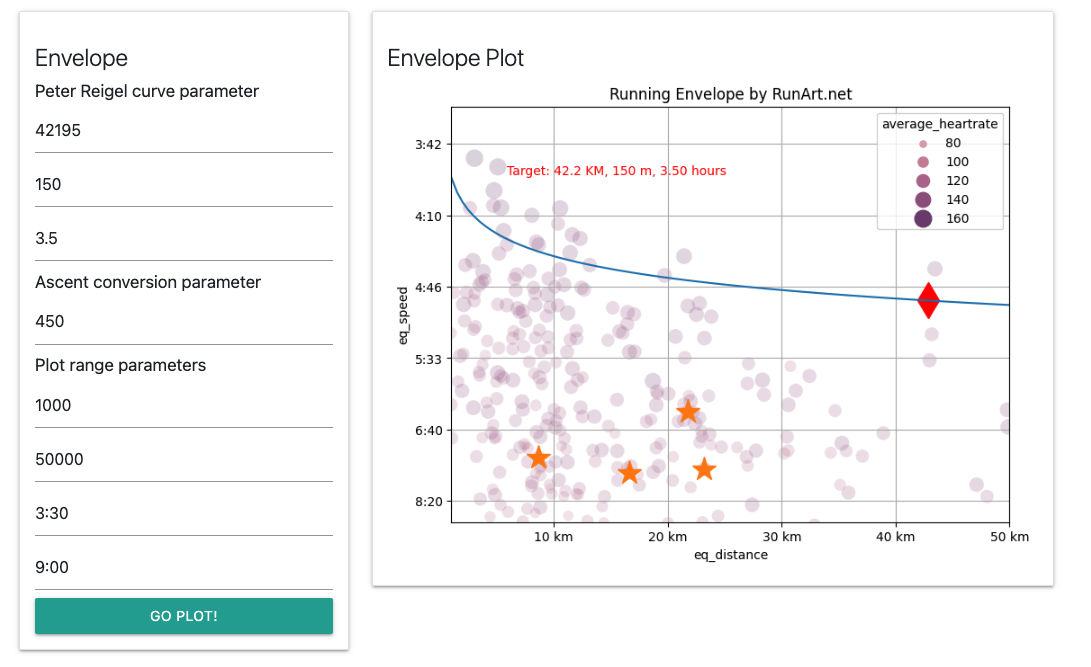
Based on information available online, we can infer the parameters for the Standard Chartered Marathon as follows: distance of 42,195m and elevation gain of 150m.
We fill in these parameters and set a target time of 3 hours.
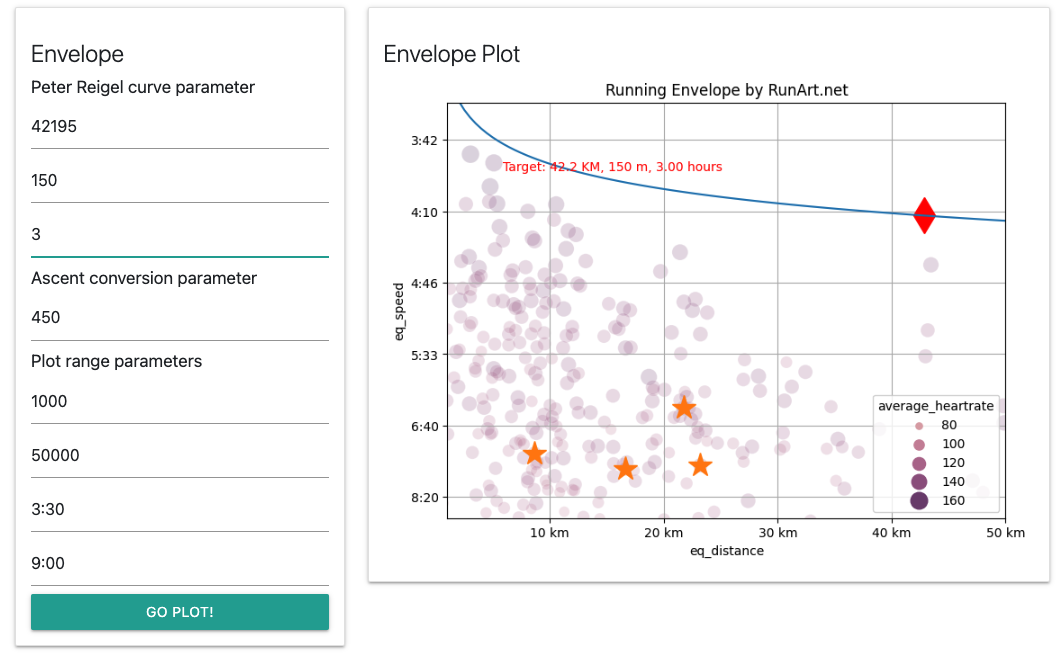
3-hour target time
We can see that the 3-hour line is an impossible goal for me because even within a shorter distance range like 10K, I cannot achieve the points indicated by the PR formula.
3:30 target time
After adjusting to a 3:30 target time, the PR line successfully crosses many points at the 10K and 20K levels. These points provide strong guidance for the target distance and time. At the 40K distance, there is a point above the PR line (current PB 3:20), and there are two points not far below, providing support. So, for me, 3:30 should be a conservative goal.
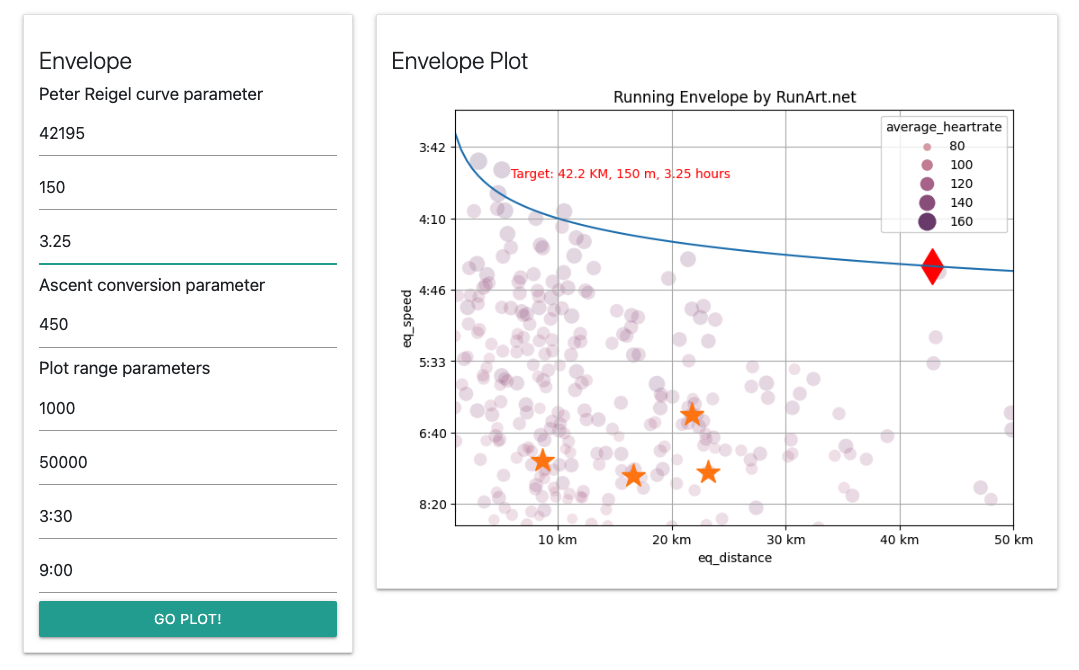
3:15 target time
Moving the curve to a target time of 3:15, we can see that the PR line crosses some shorter distance (10K) runs, indicating that my cardio capacity is sufficient. At the 20K level, there are points close to the PR line but not reaching it, and at the 30K level, there are no points close to the PR line, indicating insufficient support.
We can say that 3:15 is a goal worth pursuing, but we should be aware of the possibility of a sharp drop in speed.
Strategy
If I want to set a personal best (PB) in the Standard Chartered Marathon, I would start with a pace of 3:15 and maintain my energy level through nutrition. After passing the 30K mark, if I feel positive, I would accelerate.
Note: Since I will be running the Hong Kong 100 Ultra Trail Race (33+56+103) before the Standard Chartered Marathon, with best-case scenario having only 1-2 hours of sleep between the two races, I will not set a specific goal for the marathon and aim to finish it in 5-6 hours.
Parameters
Elevation Conversion
For trail runners, it is common to convert every 100m of elevation gain to an equivalent of 1000m distance. This is a useful but rough estimate. The conversion range can vary significantly depending on the individual and the specific context.
For professional athletes running on runnable sections, the conversion can be set to 450m. For more details, refer to the previous article "Sports Science 101" explaining the oxygen consumption formula.
In the chart tool provided by RunArt.net, we support modifying this parameter to adapt to runners of different abilities.
As an exaggerated example, if the conversion rate is changed to 2000, the 3-hour line for the full marathon would pass through many of my points, suggesting that I can achieve that goal, but in reality, it is far from the truth. This is due to some short-distance runs with elevation gain.
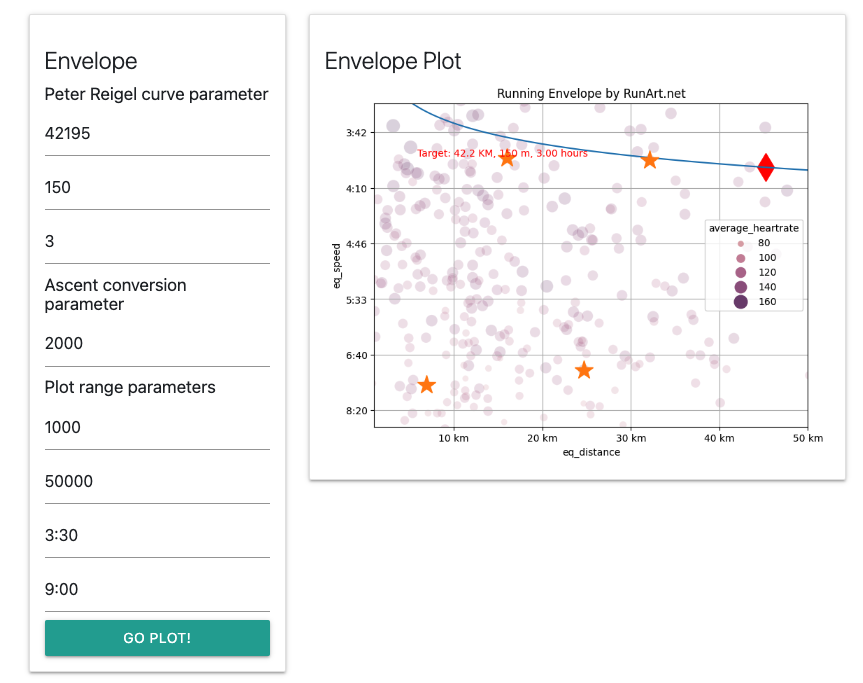
Exaggerated effect after changing the elevation conversion to 2000m.
For trail running goals, it is recommended to use 1000m as the default value and adjust it based on personal circumstances. Generally, experienced runners can set the conversion rate to 700m-800m.
For road races, it is recommended to use a conversion of 450m to avoid overestimating one's abilities.
Plotting Range
The last four parameters are actually the range of the x and y axes. Adjust them to the appropriate range based on the type of race being analyzed. These parameters do not affect the shape of the scatter plot and PR line.
Adjusting the minimum speed to 7:00 spreads the graph more on the y-axis, making it easier to read.
Deceleration Factor
In the PR formula, the default deceleration factor is 4% for every doubling of the distance. Based on our past experience, this deceleration factor is relatively reasonable for road races below the marathon distance and provides an upper limit for runners. However, for trail running, this factor is often too optimistic. In future versions, we are considering allowing users to adjust this deceleration factor for their own customization.
RunArt
RunArt is an all-in-one platform for visualizing running data and generating artistic representations.
Running is an art,
And ultra is among the finest.-- RunArt.net
After completing the Strava login and email verification, you can click the green "Request" button in the Report section of this chapter. The system will send an email to notify you that you are on the waiting list. Please be patient, as you will usually receive a reply within 1-2 days.
Requesting Advanced Report Features
Note: Due to rate limitations on the Strava data retrieval API, the advanced version of the report feature supports fetching the last 500 records. Therefore, it will be gradually opened up based on quota. If you also enjoy RunArt.net, please feel free to recommend it to other friends in need. User feedback is helpful for us to apply for higher-level developer permissions from Strava.
In addition to the power envelope chart introduced in this article, the interface also provides other interesting charts.